The results for sequence 0 are the same as the results of the loadflow calculation.
All voltages are represented as phase voltages.
The results for sequence 1 and any subsequent sequences are displayed as described below.
Network
Following each sequence in a sequential fault analysis, the results are displayed in a view.
The features of the Results menu item are described below.
General
Calculate | Results | Overview is used to display a summary of the calculated sequences.
Details
Calculate | Results | Details is used to display detailed information regarding selected nodes, branches and elements on a form.
A vector diagram is can be displayed with the Graph button.
With Appearance the notation of the voltages and currents can be changed:
•polar notation of the three phases
•polar notation in the symmetrical component system
•complex notation of the three phases
•complex notation in the symmetric component system
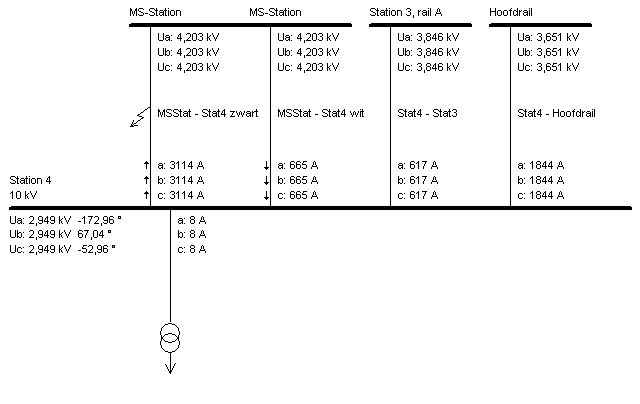
With the branches and elements, an arrow indicating the direction of flow is shown next to the current values. This direction is defined in a similar way as the directional sensitivity at the current protection and distance protection. The arrows indicate only the direction of the current where there is a direction-sensitive current protection. In the example below two directional safety devices are present.

Graph
With Calculate | Results | Graph can show the minimum of Umod a, b, c and the maximum flows in a bar chart of selected nodes, branches and elements. The nodes, branches and elements in the graph are sorted as indicated by the user. If a bar of the bar chart is clicked, the object is jumped directly to the editor.
The results can be compared with the results of a previously performed calculation, provided the results were saved with Calculate | Results Save results. To do this, the Saved item must be ticked.
Save results
With Calculate | Results | Save results, the results of a calculation can be saved for comparison with the future calculations.
Export
Almost all calculated results can be exported to Excel. In fact, the export is a fixed format report of all objects on three sheets: nodes, branches and elements.
See also: