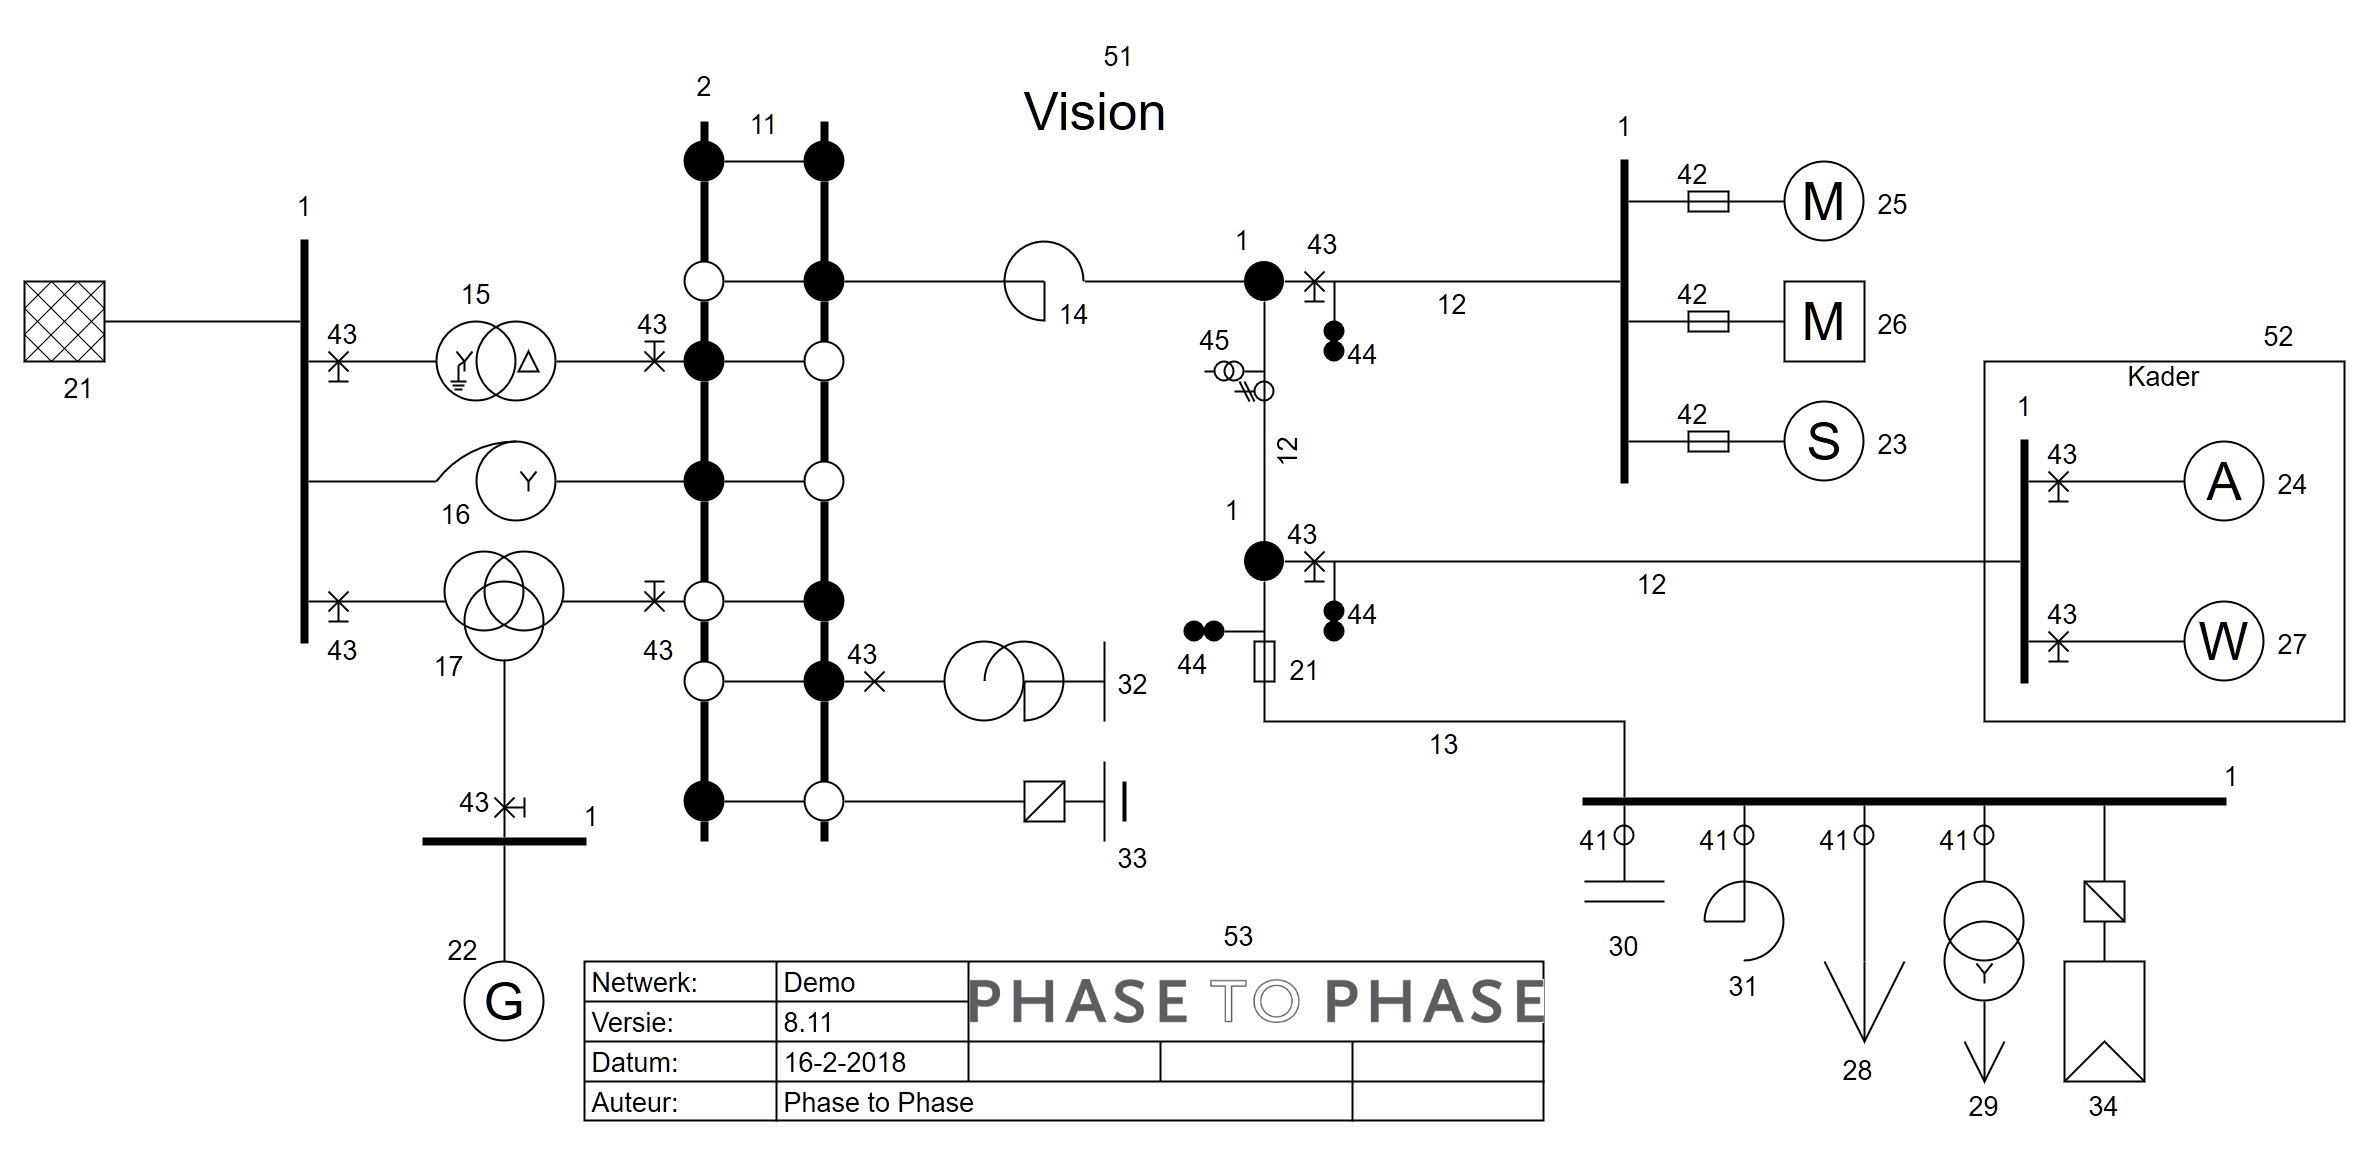
The network is the representation of the power system wherein calculations can be performed. A network is build up with objects. Objects are the network components, like nodes, branches (cables, lines, transformers), elements (loads, motors, generators), switches and various graphical objects:
•switches and protection devices
The network model is object-oriented. As a consequence, the way the objects are graphically interconnected determines the resulting power system model. All the components are objects. All components in the network are graphically represented at least once. (Parts of ) the network can appear graphically on more than one sheet, see Sheet. Every component can be represented on multiple sheets, from which the network can be further expanded, see: Multiple object presentation.
The user can define views that give a customised presentation of the text on the sheets. This same customised presentation will also be shown on the graphical print. Network data, including results, can be viewed in reports and can be printed. Reports can be defined by the user.
Together with the network data, also the properties, comments and hyperlinks can be saved. These can be consulted and printed. See Prepare.
Comments enable the user to add the necessary background information to the network file.
Besides comments, also links to documents, spreadsheets, pictures and web addresses can be attached to the network file. These links are implemented as hyperlinks. By clicking on a link, the matching program is started and the file is opened.
Graphical presentation of objects
Each object has its own graphical properties, defined on the tab Presentation of the particular object. The graphical presentation properties of selected objects can be modified collectively by means of the menu: Start | Edit | Collective, Presentation. Here you can change the: colour, size, thickness, style, text style, font, text size and text visibility.
Nodes
Nodes in the network are, for example, busbar systems and stations. Nodes are connected through branches.
Branches
Branches can be lines, cables, links , reactance coils or transformers. Transformers link nodes with different voltage levels.
Elements
Elements represent the supply and absorption of electrical energy. Elements are always linked to a node. Possible elements in Vision are:
•External grid
•synchronous generator
•synchronous motor
•asynchronous generator
•asynchronous motor
•wind turbine
•PV
•load
•transformer load
•shunt capacitor
•shunt reactor
•zigzag transformer
•battery
Switches, breakers and protections
Each branch and element can be equipped with switches, circuit breakers and protection relays. The state of the switches have to be changed in the pop-up form of a branch or element.
The representation of the circuit breaker, open switches and protection devices can be changed in through Bestand | Options | Editor, Drawing
The possible switches and protection devices are:
•load switch
•fuse
•circuit breaker
•short-circuit indicator
•measurement unit
Symbols
The following symbols are used to depict the various components in Vision.

| 1 | node |
| 2 | busbar system |
| 11 | link |
| 12 | cable |
| 13 | line |
| 14 | reactance coil |
| 15 | transformer |
| 16 | special transformer |
| 17 | three-winding transformer |
| 21 | External grid (V) |
| 22 | synchronous generator (G) |
| 23 | synchronous motor (S) |
| 24 | asynchronous generator (A) |
| 25 | asynchronous motor (M) |
| 26 | multiple asynchronous motors (M) |
| 27 | wind turbine (W) |
| 28 | load |
| 29 | transformer load |
| 30 | shunt capacitor |
| 31 | shunt reactor |
| 32 | zigzag transformer |
| 33 | battery |
| 34 | PV |
| 41 | load switch |
| 42 | fuse |
| 43 | circuit breaker with or without protection relay |
| 44 | short circuit indicator |
| 45 | measurement unit |
| 51 | text |
| 52 | frame |
| 53 | legend |