Harmonic load flow
The harmonic load flow result can be evaluated in three ways:
•in the one-line diagram
•in the detail forms
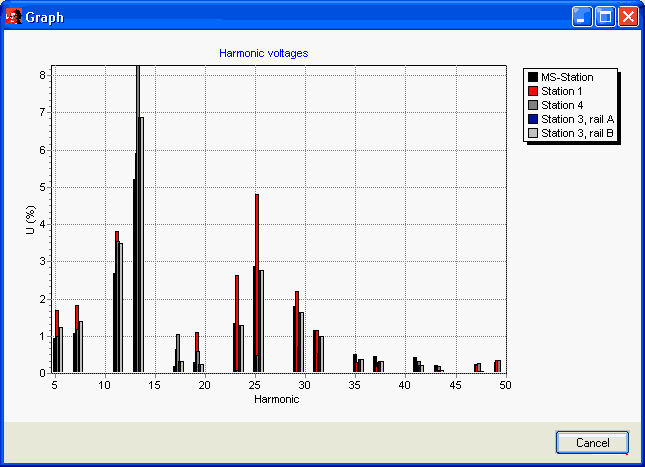
•in a bar chart
Harmonic sources result in harmonic voltages and currents in the network, which will be calculated for each relevant frequency. The RMS-values of voltages and currents are calculated as follows:
With: Vm : effective value of the harmonic voltage.
With: Im : effective value of the harmonic current.
The Total Harmonic Distortion (THD) is calculated as follows:
One-line diagram
After a successful calculation the RMS-values of voltages and the Total Harmonic Distortion (THD) on the nodes are presented in the view. For all branches the RMS-values of the currents and the THD are presented in the view.
Results, Details
In the details-form of components is presented:
•Nodes: RMS-value and THD; after clicking on the Details-button:
oHarmonic voltages in V and as percentage of the nominal voltage
•Branches: RMS-value and THD; after clicking on the Details-button:
oHarmonic currents in A
•Elements: RMS-value and average power (Pav); after clicking on the Details-button:
oHarmonic currents in A; for loads is the harmonic source current injection included
Bar chart
For all selected nodes their harmonic voltages can be presented in a bar chart, using Results | Detailed graph. If the user specified that the results should be verified to a norm, the normative maximum values will be plotted as triangular symbols in the bar chart.
For all selected branches and elements the currents are plotted.

Impedance spectrum
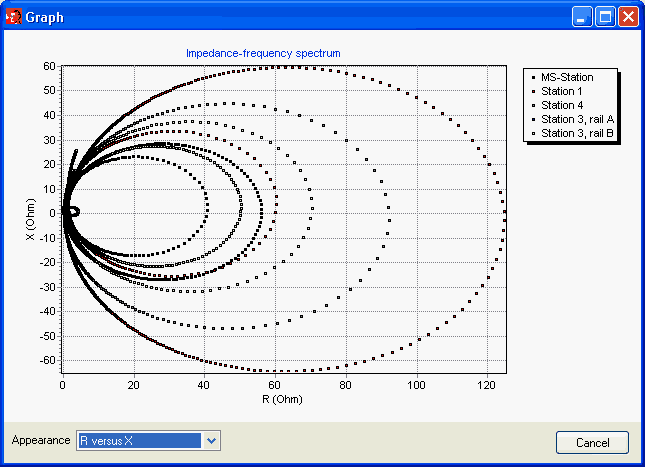
For all selected nodes their impedance spectrum can be presented. This can only be presented graphically, using Results | Detailed graph.
•R: resistance as function of frequency
•X: reactance as function of frequency
•Z: absolute value of impedance as function of frequency
•R&X: resistance and reactance as function of frequency
•R/X: resistance and reactance as complex vector diagram

Export
Almost all calculated results can be exported to Excel. In fact, the export is a fixed format report of all objects on three sheets: nodes, branches and elements.
See also: