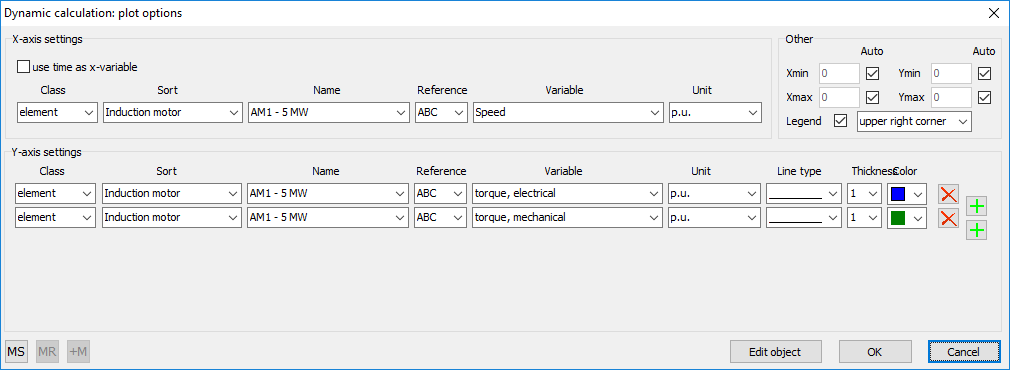
Results of a dynamic calculation are shown in the form of graphical plot. If you click an object with the right mouse button after performing a dynamic calculation, the form with the options of the plot will appear.

The plot options can be saved in memory by means of MS button. MR button sets the options from the memory to the form (options that are already entered in the form will be erased). +M button adds saved options to the initially entered options. These functions are handy in case there are plot options that needed to be used often.
You can choose variables that will be shown on the plot. It is also possible to choose variables of other object, for example, to show currents of a synchronous generator and currents through a cable on the same plot. Adding and removing variables can be done by button in the right part of the form.
Class gives access to the list of the following types of objects:
node: |
only nodes; |
element: |
synchronous generator and motor, induction generator and motor, grid, load, transformer load, shunt capacitor, shunt reactor, zigzag transformer; |
branch: |
cable, cable/line equivalent, link, reactor, transformer; |
Workspace: |
saved or imported variables. |
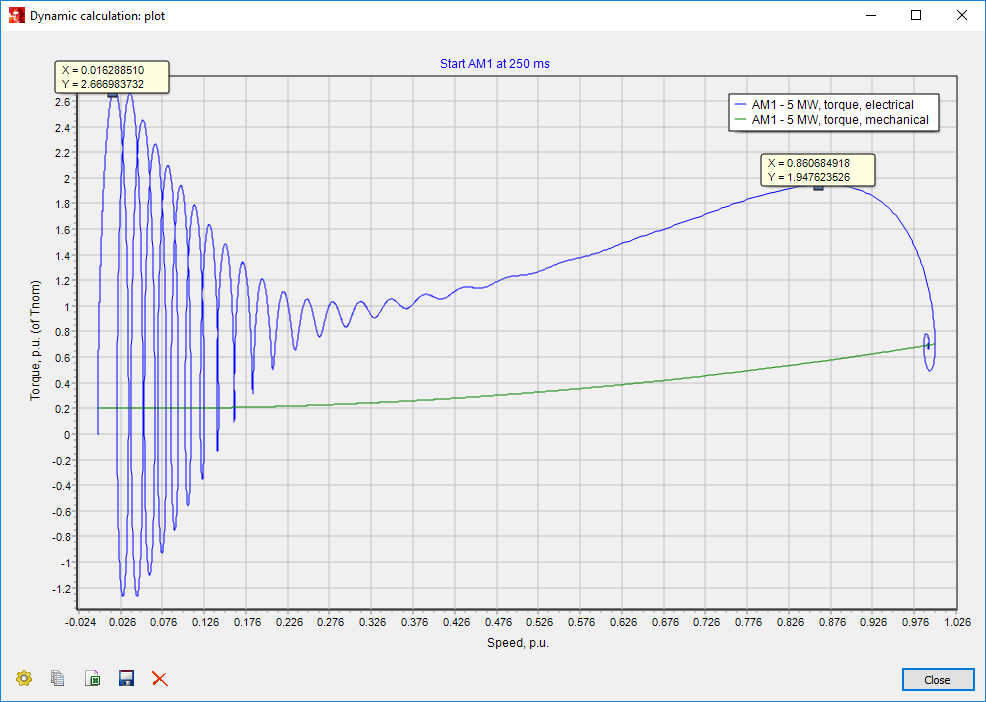
The variables to be plotted can be chosen using the form shown above. Time is used by default as x-axis variable, but it is also possible to choose another x-axis variable. An example of this, the torque-speed curve of an induction machine is plotted below:

The following buttons are available:
•Options: go back to the options of the plot (for instance, to adjust the thickness of lines or add new variable)
•Copy: copies the plot to the clipboard. Then the plot can be pasted in the form of picture, for instance, in Microsoft Word.
•Export: exports the numerical values to Microsoft Excel.
•Save to workspace: saves numerical values to the workspace.
•Delete marks: the marks on the plot can be deleted.
The title of the plot as well as the x- and y-axis labels can be adjusted by clicking on the respective text. Also the legend can be changed using the same principle. By clicking on a specific point of the curve, corresponding numerical values for x- and y-axis coordinates of the point can be obtained.