To analyse different scenario’s or to validate simulation results with external (measurement) data, variables can be saved or imported into the workspace. Those variables can now be used during the session to be compared with other workspace variables or with current simulation data.
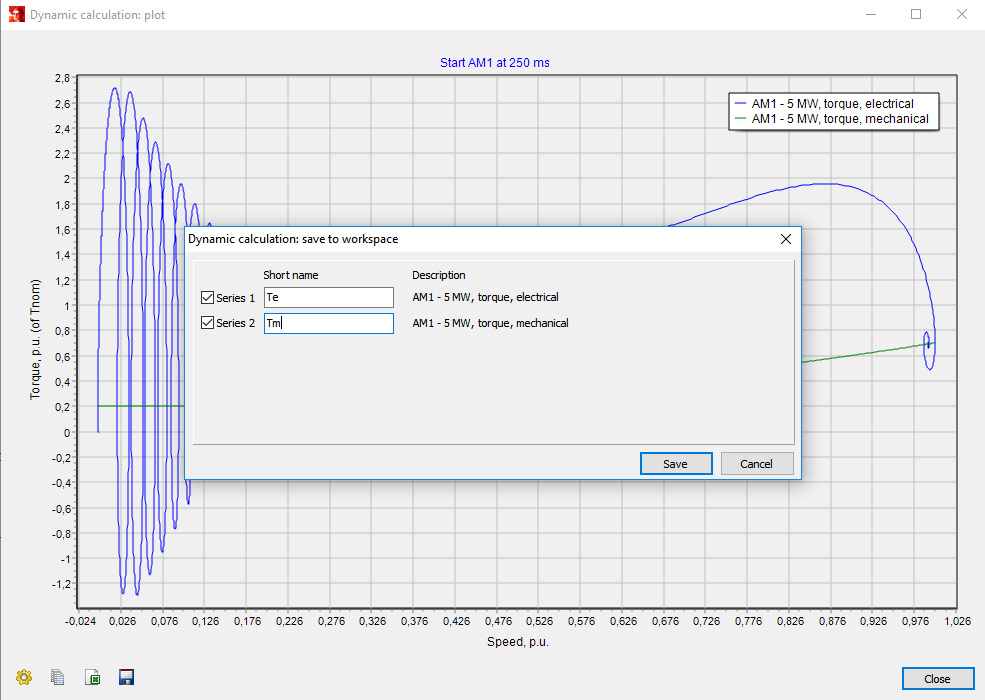
By choosing Save in the graphical plot of a variable the form below will open. Using this form one can choose which variable to save, each variable has to be provided with a name. The x- and y-axis variables (over the complete simulated period) of each signal are saved together with the short name, case, class, sort, reference, variable, unit, and the filename of the Vision Network File (.vnf).
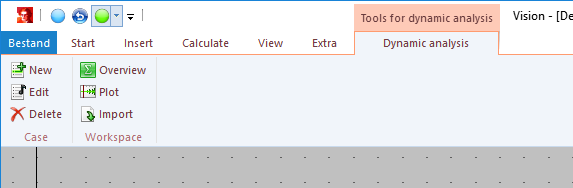
The workspace is accessible via the menu Start | Dynamical analysis | Workspace. Here variables can be viewed, plotted or imported.
By choosing Overview the saved or imported variables are shown. Using this form variables can be changed, deleted, or the numerical data can be shown.
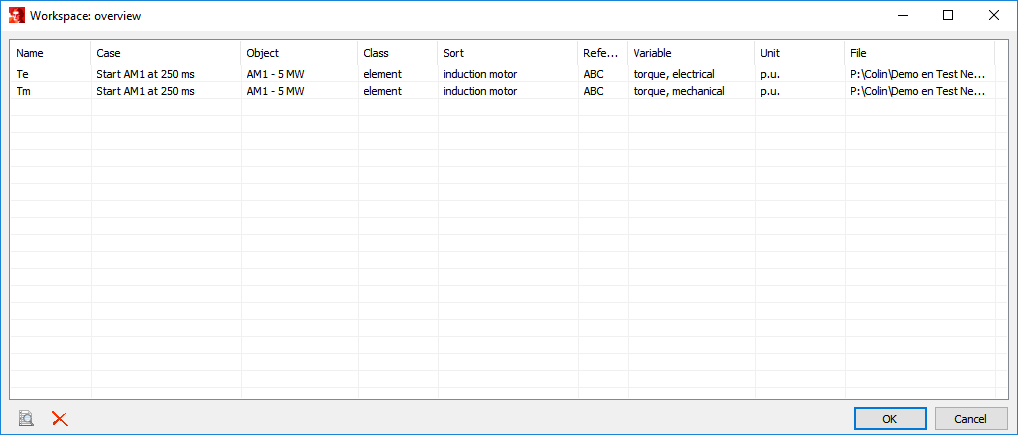
By double-clicking on a variable or by selecting a variable and choosing the magnifying glass the following form will be shown.
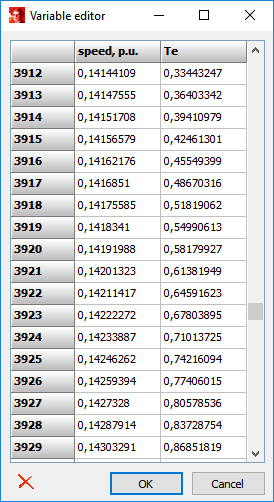
Here, the numerical values of the variable are shown and can be adjusted, deleted, or copied (Ctrl+C) to the clipboard.
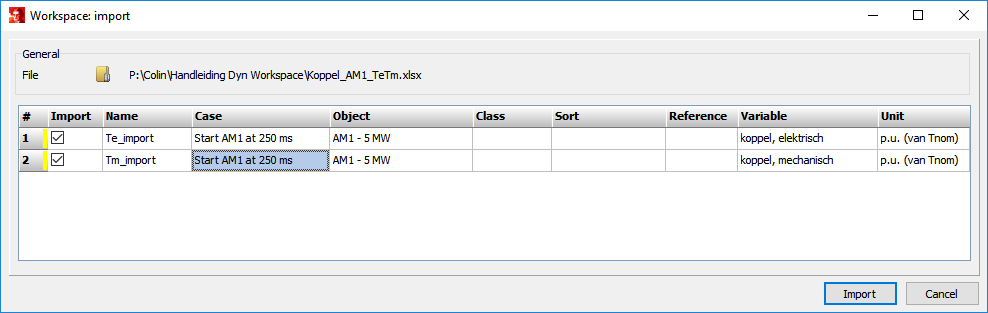
To validate simulation results, measured data can be imported into the workspace via Dynamical analysis | Workspace | Import. Besides the import of measured data exported data from previous Vision sessions can be imported, this is a convenient method to use simulation results over multiple sessions (all the workspace variables are deleted after each session).
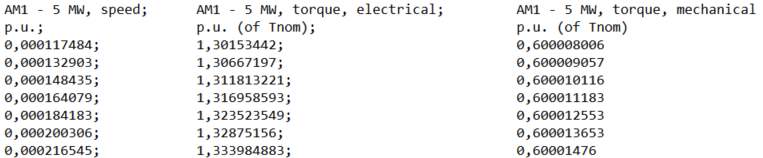
Vision can read files of five different extensions: .txt, .csv, .xls, .xlsx, and .adf files. A file with the extension .adf is the standard export file used by PlotXY (a program commonly used to plot ATP/EMTP results). The columns in a .csv file have to be separated by a semicolon symbol ‘;’ (in some countries the comma is used as decimal mark), for a .txt file the separator is a tab. The first column contains information of the x-axis variable and the other columns – y-axis variables. The first row of each column is used to provide the variable description and the second row gives information about the unit of the variable. The format of the import file is identical to that of the export file of Vision Dynamical Analysis. Below an example of a .csv file is provided:
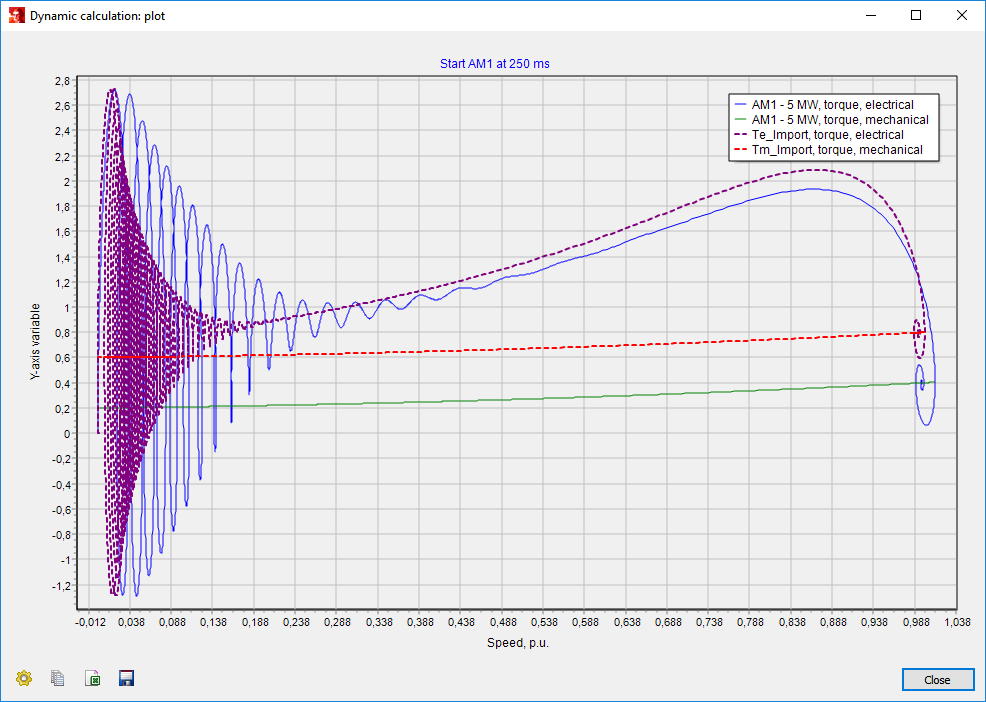
The workspace variables can be plotted by choosing Dynamical analysis | Workspace | Plot or directly after performing a dynamic simulation by a right mouse click on an node, element, or branch.
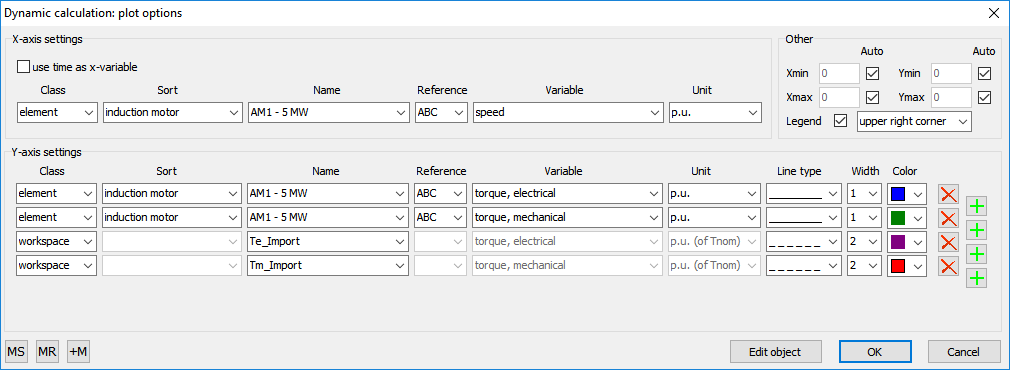
The workspace variables can be accessed by choosing ‘workspace’ in the Class pull-down menu. An example of the results of two different dynamic simulations of the start of a 5 MW asynchronous motor with different load characteristics is provided below. The dotted lines represent the responses of workspace variables and the solid lines show current simulation results.