Network
After a protection calculation the results are presented on the screen. The results are presented as follows:
•Simulation calculation:
oNodes: switch off sequences (short circuit current and switch off times)
oBranches: I² t as percentage of I(max)² t (branches that are overloaded are coloured with the "high" colour).
oBranches: I² t as percentage of I(max)² t when protections and switches fail to operate (refuse).
•Selectivity calculation:
oNodes: yes/not selective
oBranches: yes/not selective
The options from the menu-item Results are described below.
Calculation
The menu option Results | Survey gives a global presentation about overload and selectivity.
Simulation calculation:
•number of overloaded branches (I² t)
Selectivity calculation:
•number of components that are yes/not selectively protected
Details
The menu item Results | Details presents the detaild results for nodes, branches and elements. If more than one component is selected, the range can be viewed using Next and Previous. Also by mouse clicking on neighbouring components the user can walk through the network by viewing detailed results information. For a simulation analysis the following results are available per node:
•Simulation calculation:
fault type, node name, fault impedance
range of sequences; per sequence the following:
Ik": short circuit current on the faulted node (3 phases)
switch:
t: absolute switching time
phase(s): switched phases
name: switch name
protection:
name: protection name
sort: current/earth fault/voltage/distance/differential
trigger(s): measured value per phase
zones: stage/zone in the protection per phase *)
t: absolute trip time
•Selectivity calculation on nodes:
fault type and node name
fault range; per fault:
Rff or Rfa: fault resistance phase to phase or phase to ground
Ik": short circuit current (3 phases)
all activated protections; per protection:
type
protection name
switch name
t: initial switch off time per phase
•Selectivity calculation on branches:
the same results as on nodes, but for all cable calculation steps.
*) The stage/zone is related to the protection characteristic. The next code has been used.
•Fuse: the largest current-time point in the characteristic which is smaller than the actual current
•Current protection with curve: the largest current-time point in the characteristic which is smaller than the actual current
•Current protection with fixed time: the largest current-time point which is smaller than the actual current (1, 2 or 3)
•Current protection with inverse characteristic: actual current in the curve:1; current larger than I>>: 2; current larger than I>>>: 3
•Current protection with special characteristic: actual current in the curve:1; current larger than I>>: 2; current larger than I>>>: 3
•Current protection with specific characteristic: current larger than I>: 1
•Voltage protection: voltage larger than U>: 1; voltage larger than U>>: 2; voltage smaller than U<: -1; voltage smaller than U<<: -2
•Distance protection: according to the defined 3 zones; directional end time: 4; backwards: -1
•Differential protection: 1
Graph
The menu item Results | Graph graphically shows the results for selected nodes and branches.
After a simulation calculation this is per node the course of short-circuit current and time.
After a selectivity calculation this is per node the current through the different protections as a function of the short-circuit current at the fault node, or the switch-off time of the different protections as a function of the short-circuit current.
After a simulation calculation for selected branches the branch load I²t / I²tmax can be shown in a bar chart.
The components in the graph are sorted as indicated. The axes are scaled automatically or in a given range.
By clicking on a bar in a results bar chart, the user jumps directly to the concerning object in the one-line editor.
The results may be compared with results of another calculation, is saved with Results | Save. Use the check-box "Saved".
Simulation calculation
After a simulation calculation for all components, where a short circuit is simulated, the course of the short-circuit current as a function of time is presented. For all branches that feed into the short circuit, the branch load I²t / I²t(max) can be shown in a bar chart.
Results | Graph
•Presents for all selected branches that feed into the short circuit, the maximum I²t / I²t(max) as percentage in a bar chart. Appearance: without or with refusing protections/switches.
•Presents no results for nodes
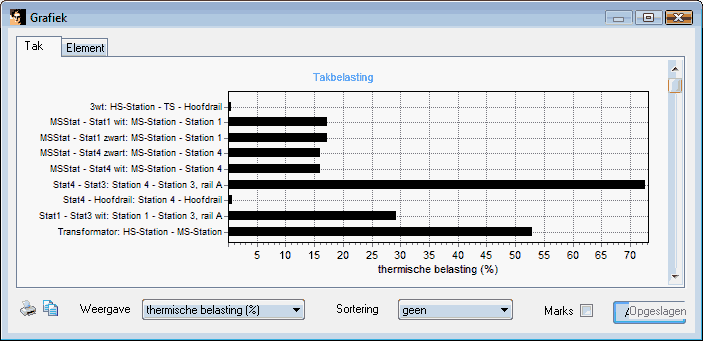
Figure: branch load after a simulation calculation
Results | Detailed graph
•Presents for all short circuited objects (nodes/cables/elements) the simulated course of the short circuit current (Ik") on the fault location as function of elapsed time. This graphic presentation corresponds with the results of the short circuited objects, presented with Results | Details | Details.
•Presents no results for currents in branches that feed into the short circuit.
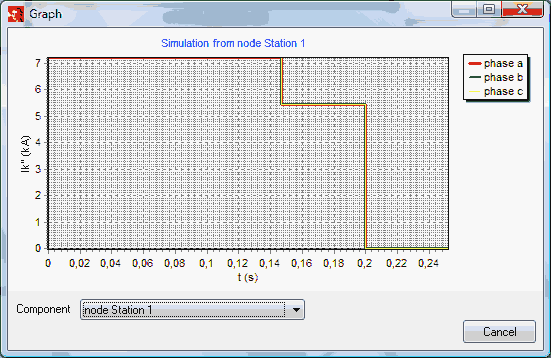
Figure: short circuit current as a function of elapsed time after a simulation calculation
Selectivity calculation
The selectivity calculation is performed for a range of short circuit currents, obtained by varying the fault impedance. The fault impedance range can be defined in the Options, at: Calculation | Protection. After a selectivity calculation, for all short circuited objects (node/cable/line) the switch off times as function of the short-circuit currents on the fault location are presented.
Nodes and branches are presented in the too high colour if the protection is not selective.
Fuses and circuit breakers are presented in the Attention colour if they switch off unwanted for any combination of fault location and fault resistance.
The colours can be defined in the Options, at Calculation | General.
Detailed results | graph
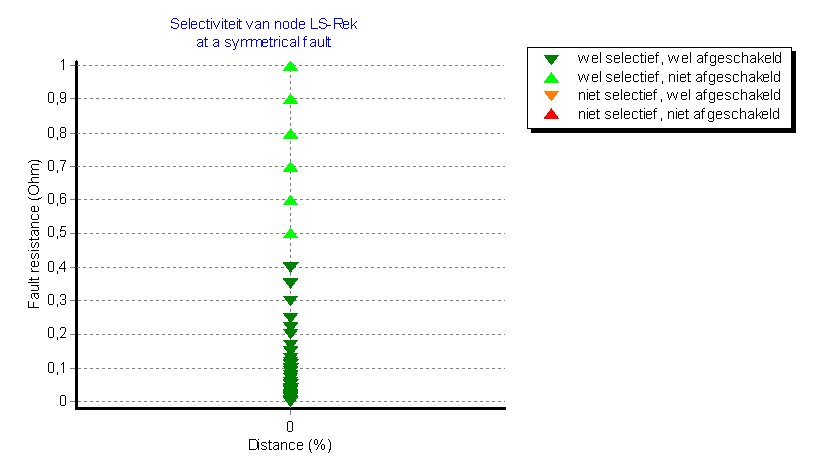
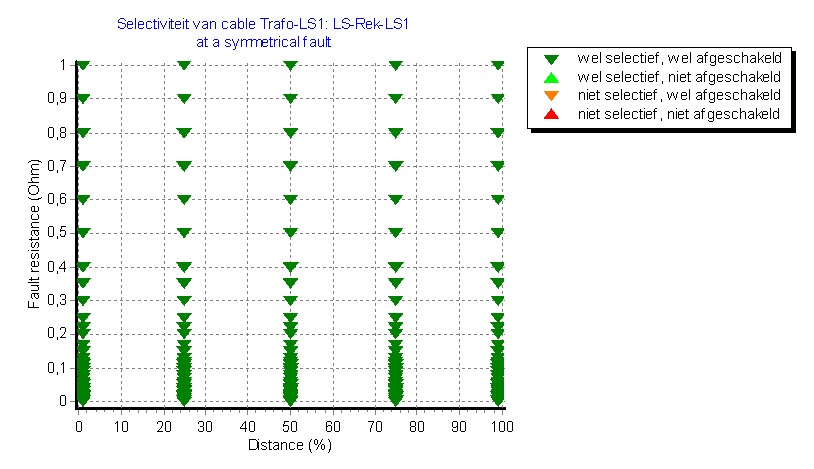
The protection selectivity of an object can be presented in a graph, summarising selectivity and whether a fault will be switched off or not. If in the Options has been specified to calculate the selectivity over a range of fault resistances, this function allows the user to see up to what fault resistance an object is properly protected (selectively and correctly switched off). In the next example, the node is selectively protected, but a short-circuit with a fault impedance larger than 0.4 Ohm will not be switched off. All short-circuits in the cable will be switched off.
Results | Graph
•Presents no information after a selectivity calculation
Details | Graph
Presents per short circuited object the results for the intended or real switch off sequences:
•intended switch off: intended switch off times for all breakers whose protections have triggered
•real switch off: switch off times of actually opened switches or blown fuses. The times for the largest short circuit current in this graph match with the result of a simulation calculation, presented with Results | Details | Details.
The following figures illustrate the differences between presentation of the intended and real switch off times in a meshed network. As example the demonstration network "demo.vnf" has been used to examine the selectivity for a fault on node "Station 3, rail B". In the Options, at Calculation | Protection, the fault impedance has been defined in the range from 0 to 10 Ohm.The selectivity will be examined for each fault impedance. According to the graph below, the protection of fault will be selective if only the switches in the lines "Stat1-Stat3 wit" and "Stat4-Stat3" will be opened. Eventually the generator may be switched off.
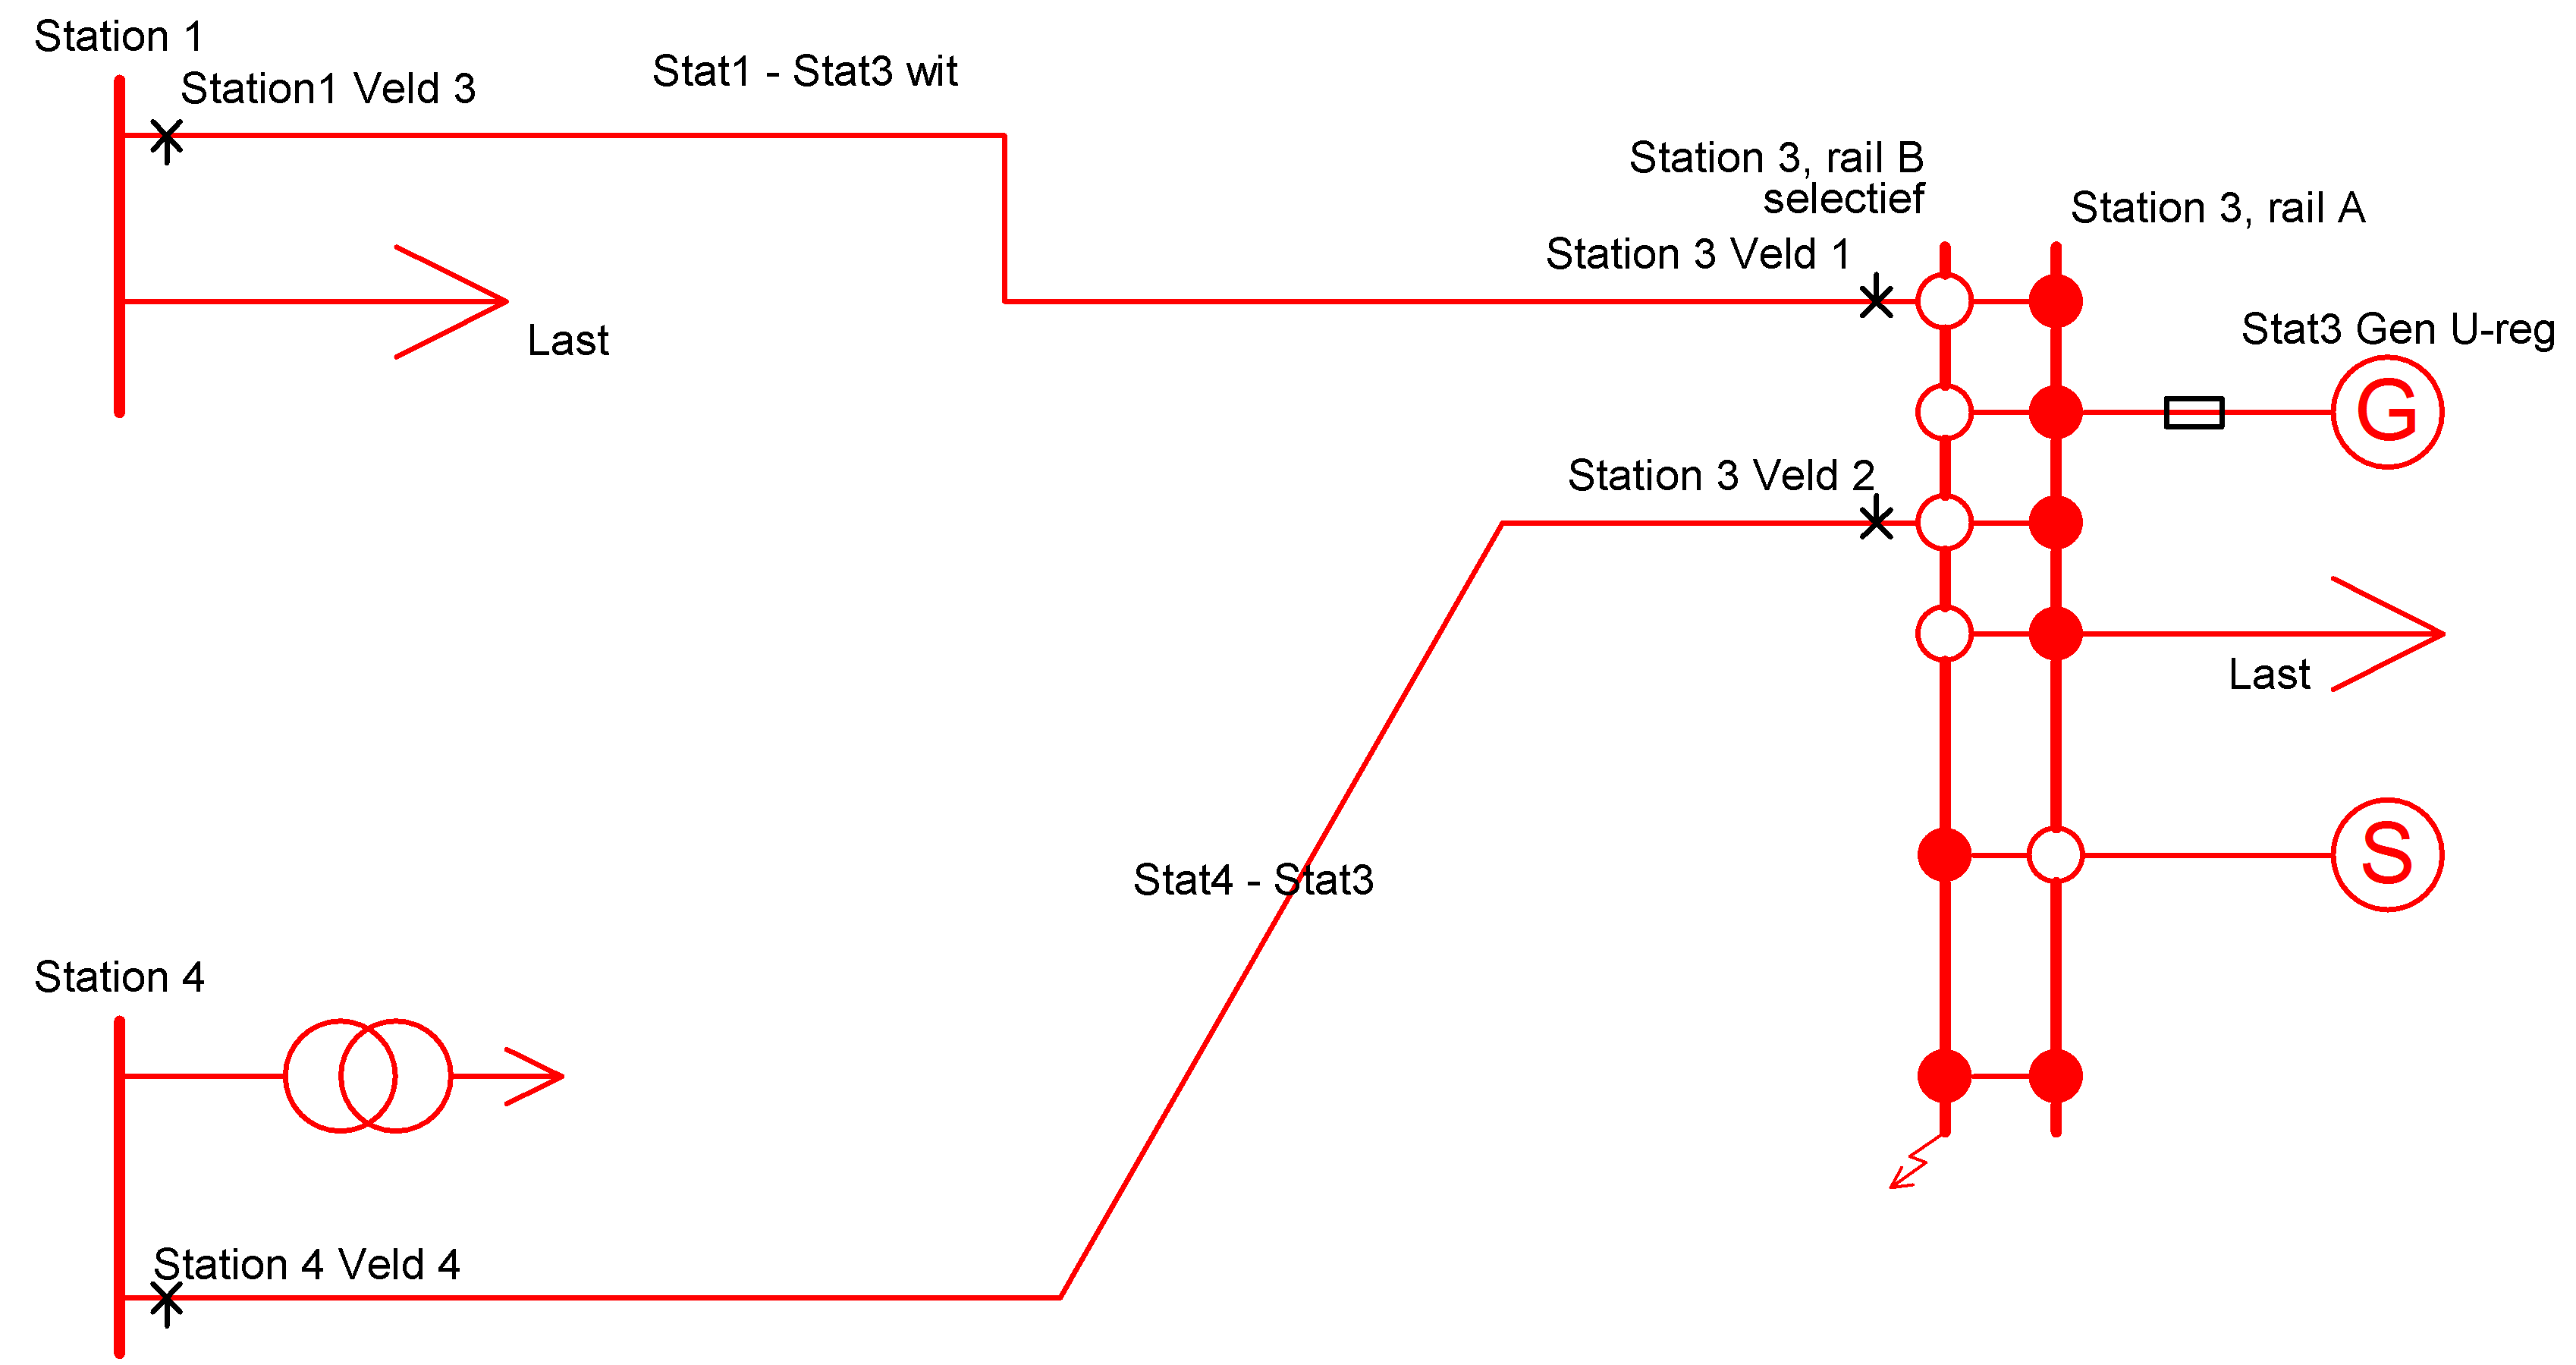
The first figure (intended switch off) shows that many protections have detected the short circuit and will pick up. The curves of the protections that might selectively switch off the short-circuit current have a square symbol marker. The curves of the protections that will not selectively switch off the short-circuit current have a triangle symbol marker.
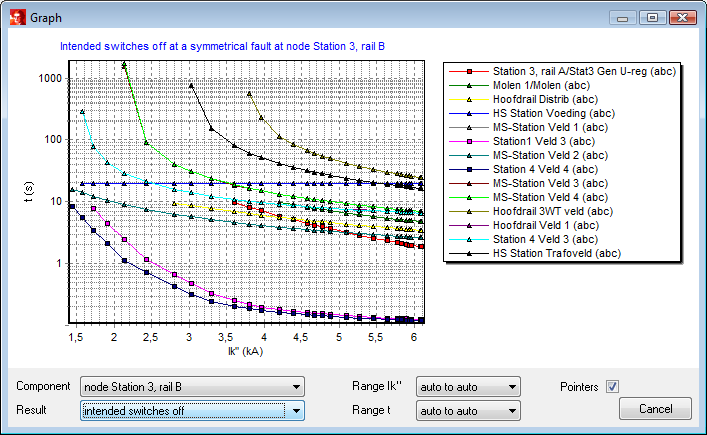
Figure: selectivity graduation of switch off times before a switch opening
The second figure (real switch off) shows that the short-circuit on the selected node for the defined range of fault impedances is protected selectively. Only the switches in the mentioned lines and the generator protection will switch off.
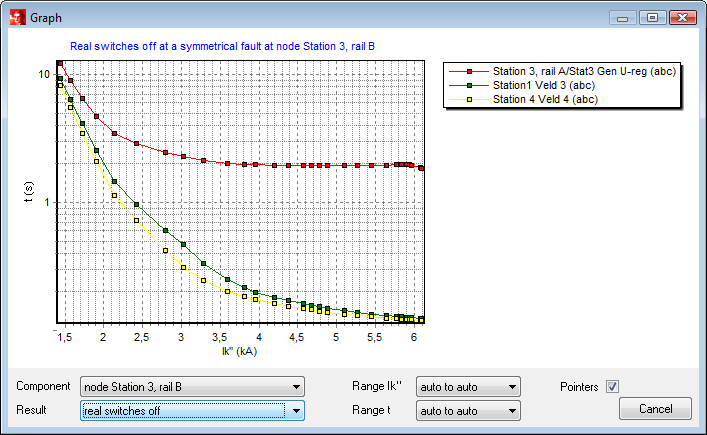
Figure: switch off times
Save
With Results | Save the results of a calculation can be saved to compare with another calculation result in Results | Graph..
Export
Almost all calculated results can be exported to Excel. In fact, the export is a fixed format report of all objects on three sheets: nodes, branches and elements.
See also:
•Maximum current protection characteristic