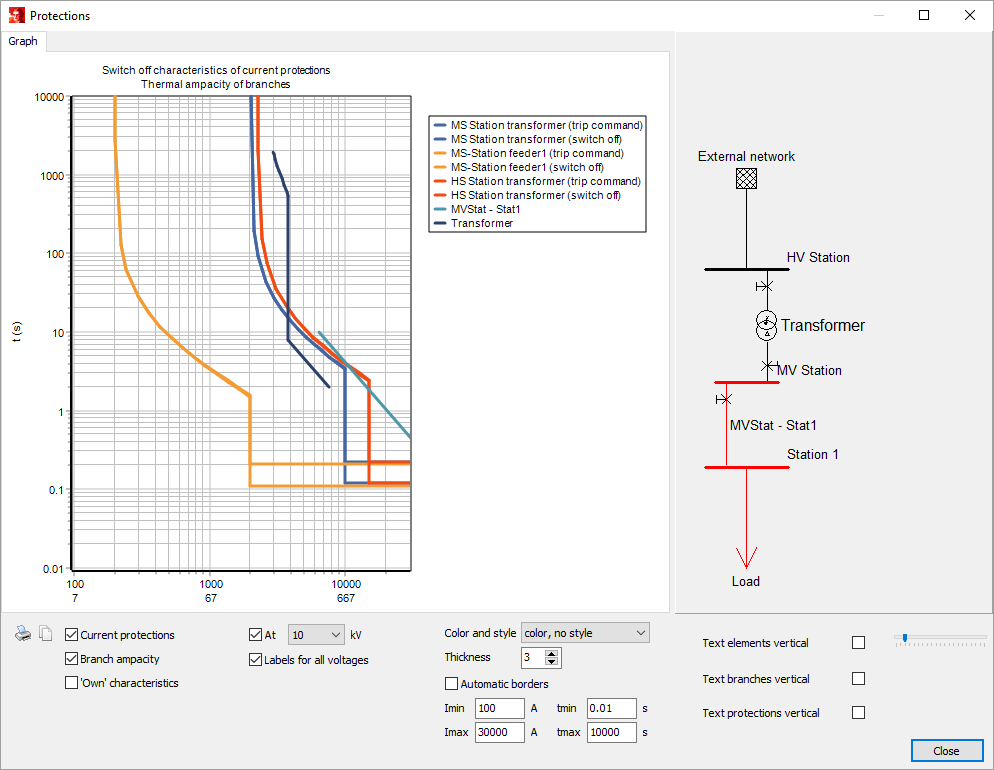
The characteristics of selected overcurrent protections can be shown together in one plot through the use of Tools | Compare | Protections. Defined tripping times are shown as function of the current. The switching characteristics can be combined with the branch ampacities, to spot possible thermal overloading of the cables.
The shortest route (the smallest number of branches) between two selected nodes/elements can be selected using Start | Select | Route or pressing Ctrl+R. In case protection devices are selected in this way, the route is automatically plotted next to the time-current curves.
•First, select the node at the beginning and at the end of the route.
•Then use Start | Select | Route (or Ctrl+R), to select the route.
•Hereafter the protections tool can be started:Tools | Compare | Protections.
•The route will be shown next to the plot. Its size can be changed with the slider in the lower right corner of the window. The direction of text for elements, branches and protection devices can be set using respective checkboxes.

Vission finds the optimal orientation of the part of the network (the selected route) to be drawn. The node located at the left or at the top in the network diagram is placed on top of the automatically generated diagram.
The checkbox Current protections determines whether time-current curves of overcurrent relays will be shown on the plot.
Branch ampacity plots I2t characteristics of selected cables and lines. For transformers the damage curve according to the IEEE Std C57.109 (IEEE Guide for Liquid-Immersed Transformer Through-Fault-Current Duration) is drawn.
Motor start sets the point with coordinates: starting current on x-axis and starting time on y-axis (these numbers are specified on tab Induction motor | Connection).
The time-current curves can be displayed for their own specified voltages or transformed to a chosen voltage. To alter the voltage level check the box before At and select the voltage level from the drop-down menu. This option is handy for evaluating the protection devices on different sides of a transformer.
Labels for all voltages shows currents (x-axis labels) for all voltage levels of selected objects.
Time-current curves can be also displayed in black and white and/or using dashed lines. The colour and style can be used to adjust the following:
•with/without colour
•with/without different line styles
•thickness of lines
Plot limits can be set automatically or adjusted manual.
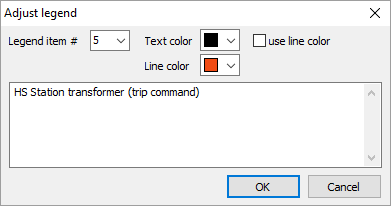
The plot can be copied or printed by pressing the copy or printer icon in lower left part of the window or by using the shortcuts (Ctrl+C or Ctrl+P). The colour of a line in the plot, its order in the legend and the corresponding text can be adjusted via a right mouse click on the legend item or the line on the plot. respectively

Using the left mouse button on a line will show the coordinates of a point on the line.
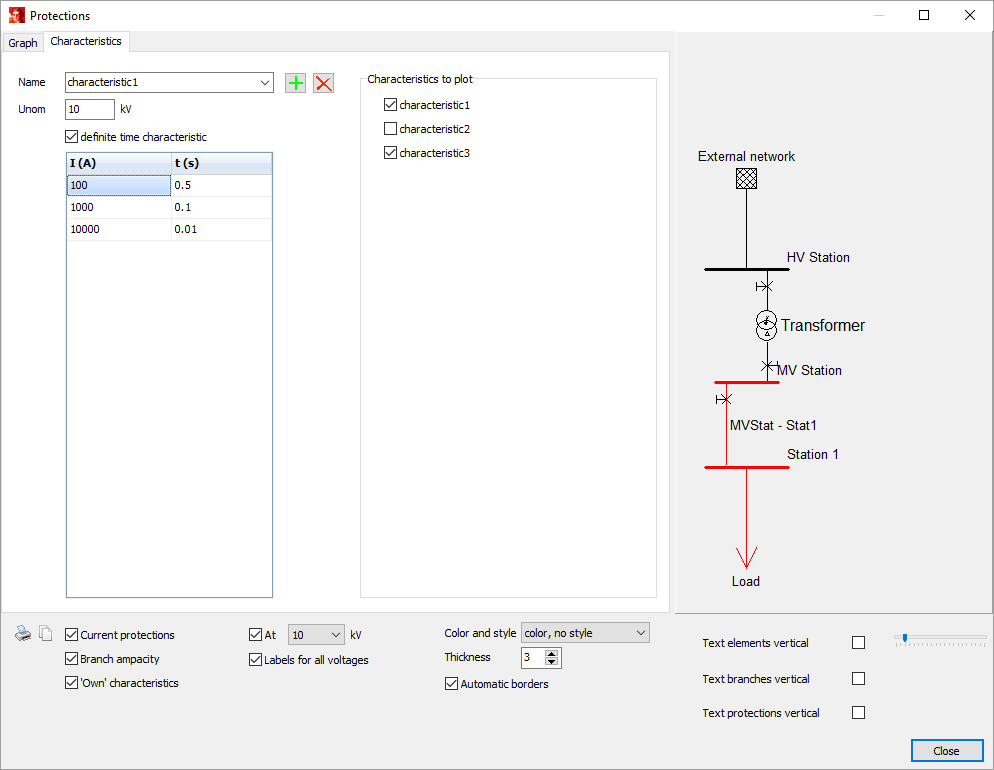
After checking the ‘Own’ characteristics checkbox the tab Characteristics will appear. Here, the user can define there own characteristics to be shown in the plot.

This can be done as follows. First, the nominal voltage can be set (for deviating voltage and checked At option the currents of the own characteristic will be recalculated during plotting). Definite time characteristic checkbox determines whether the characteristic will be plotted in the form of stages (checked state) or in form of points on a curve (unchecked state). Further points in the time-current plot can be entered. It is possible to enter as many points as are needed, pressing Enter or Tab will add an extra row if necessary. After that the name of characteristic can be specified, and it can be added to the list of characteristics by clicking the plus icon to the right side of the input field. Removing a characteristic is possible with the icon next to it (in case of multiple characteristics are defined the desired characteristic first has to be selected from the list). In this way the characteristics can be created, selected and removed. Using the checkbox characteristics to plot, it can be determined whether the added characteristic shows in the figure.