The results of a network analysis calculation can be viewed in three ways:
•in the node detail output form: the maximum voltage dip and the maximum dip duration
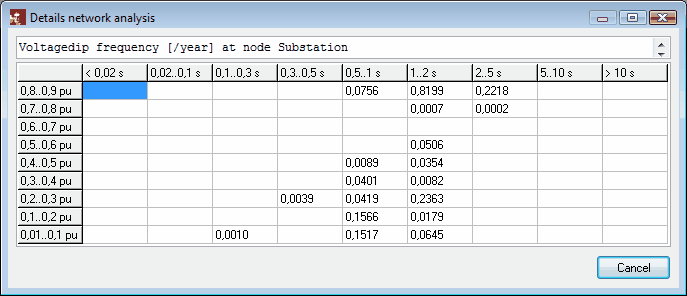
•extended detail for each node: table with voltage dip frequencies, classified in 9 dip depth categories and 9 dip duration categories
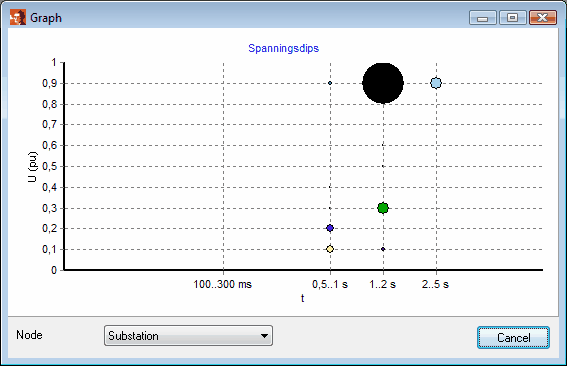
•graphically for each node: circles diagram of voltage dip frequencies, classified in 9 dip depth categories and 9 dip duration categories
Extended detail output form
Next table presents an example of the voltage dip frequencies for one node "Substation", classified in 9 dip depth categories and 9 dip duration categories.

Circles diagram
Next graph presents an example of the voltage dip frequencies for one node "Substation", classified in 9 dip depth categories and 9 dip duration categories. The circle size represents the frequency.

See also: