The network diagram can be projected on a geographical layer using:Tools | Geography | Map. There are three different viewers available:
•Grid navigator (an add-on of Vision)
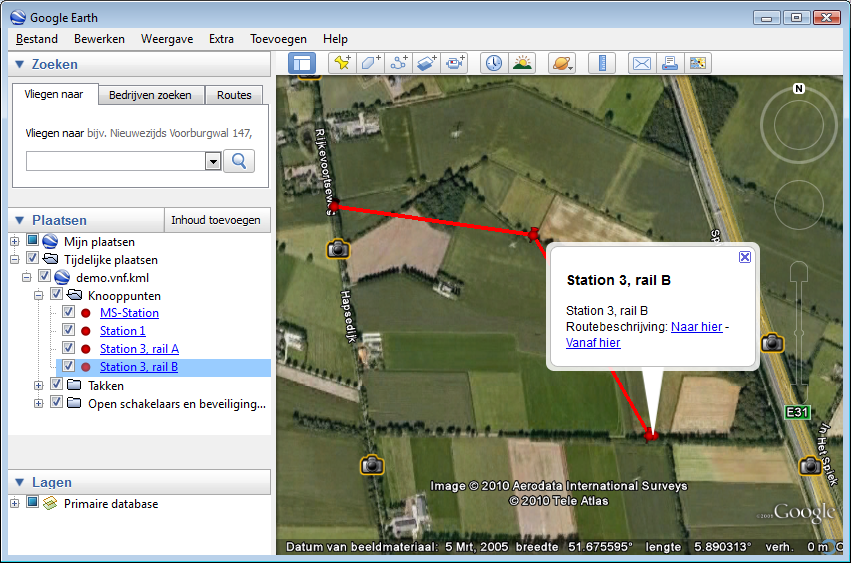
•Google Earth
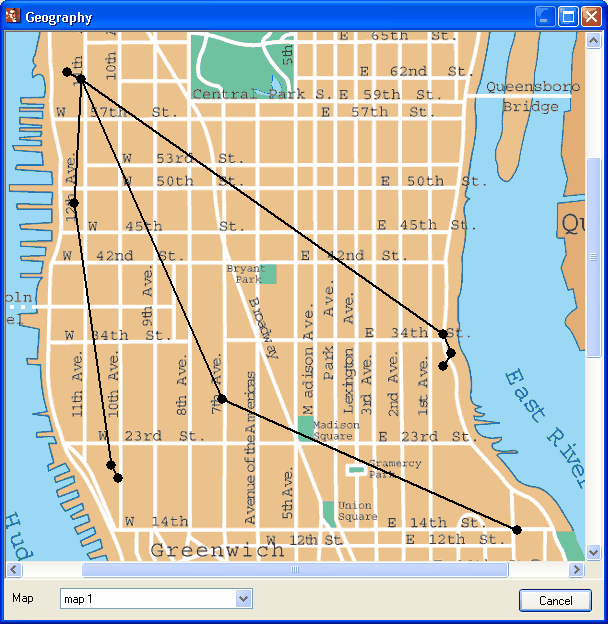
•Map: a bitmap image, in which the coordinates of the vertices are recorded. The size of the area on the screen is defined in the graphic properties of the bitmap image.
The coordinates of the nodes can be entered on the "Geography" tab of the node form or be imported. The coordinates of intermediate points of branches can only be Imported. All nodes whose X and Y coordinates are specified, are shown on the geographic background. The branches between the nodes are automatically displayed.
The coordinates can either be given in the RD new coordinate projection (EPSG 28992) or in the decimal geographical degrees format.
The geographical map should first be defined in Options | Geography | Maps.
Example of the map view:

Example of the Google Earth view:

See: Options, Geography.