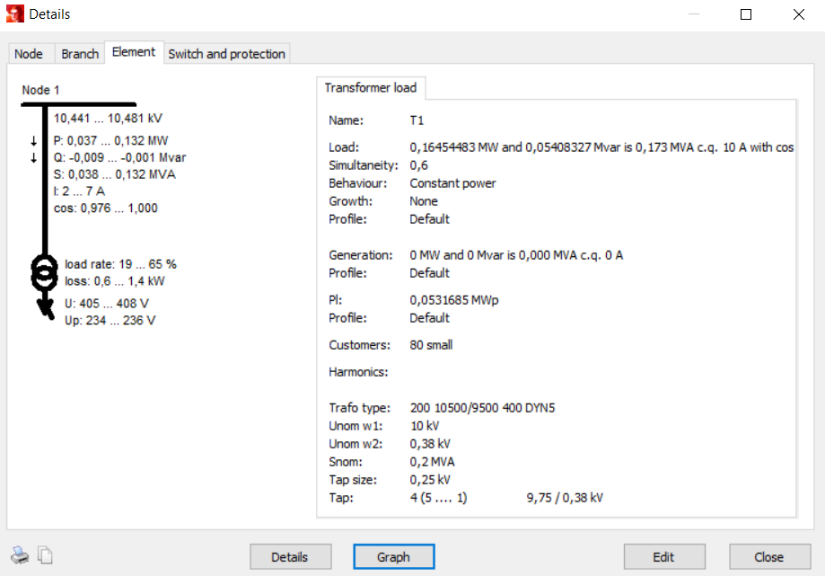
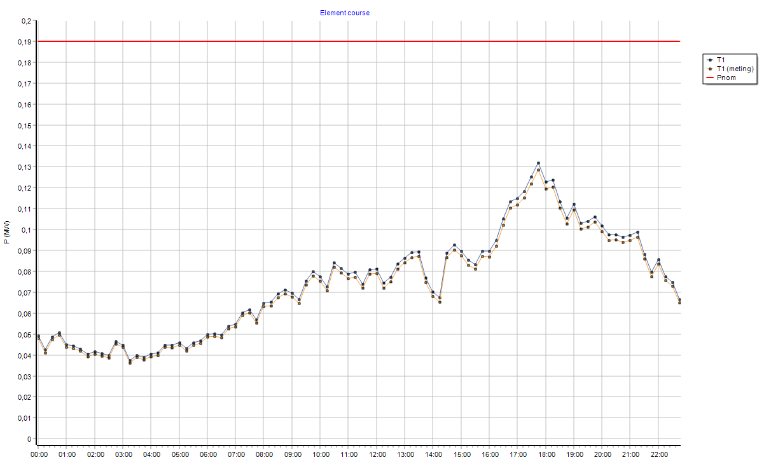
After computation, the results can be viewed for any object by right clicking it and using the Details button to display numerical results and the Graph button for making a plot.

As seen, the values shown are the range between maximum and minimum in which the variable varies in a computed time period. It is to be noted that these maximum or minimum values of different variables do not necessarily occur at the same instance, i.e. Pmax = 0,132 MW and Qmax = –0,001 Mvar shown in the example above might happen at different times.

The different types of variables like loading percentage, active power, reactive power, voltage, current and so on that need to be plotted can be selected in the graph view with the dropdown box at the bottom. The graph can also be exported in multiple formats (metafile and bitmap) using the right mouse button context menu. The plotting of individual points can be eliminated to display only the continuous line by unchecking the "Points" option. If multiple objects were selected before clicking on Graph button, the results for all these objects will be plotted.
The colors and the details when Data driven load flow is performed is similar to that of result from load flow with profiles.