
Vision Network Analysis
Planning, design and control of transport, distribution and industrial grids.
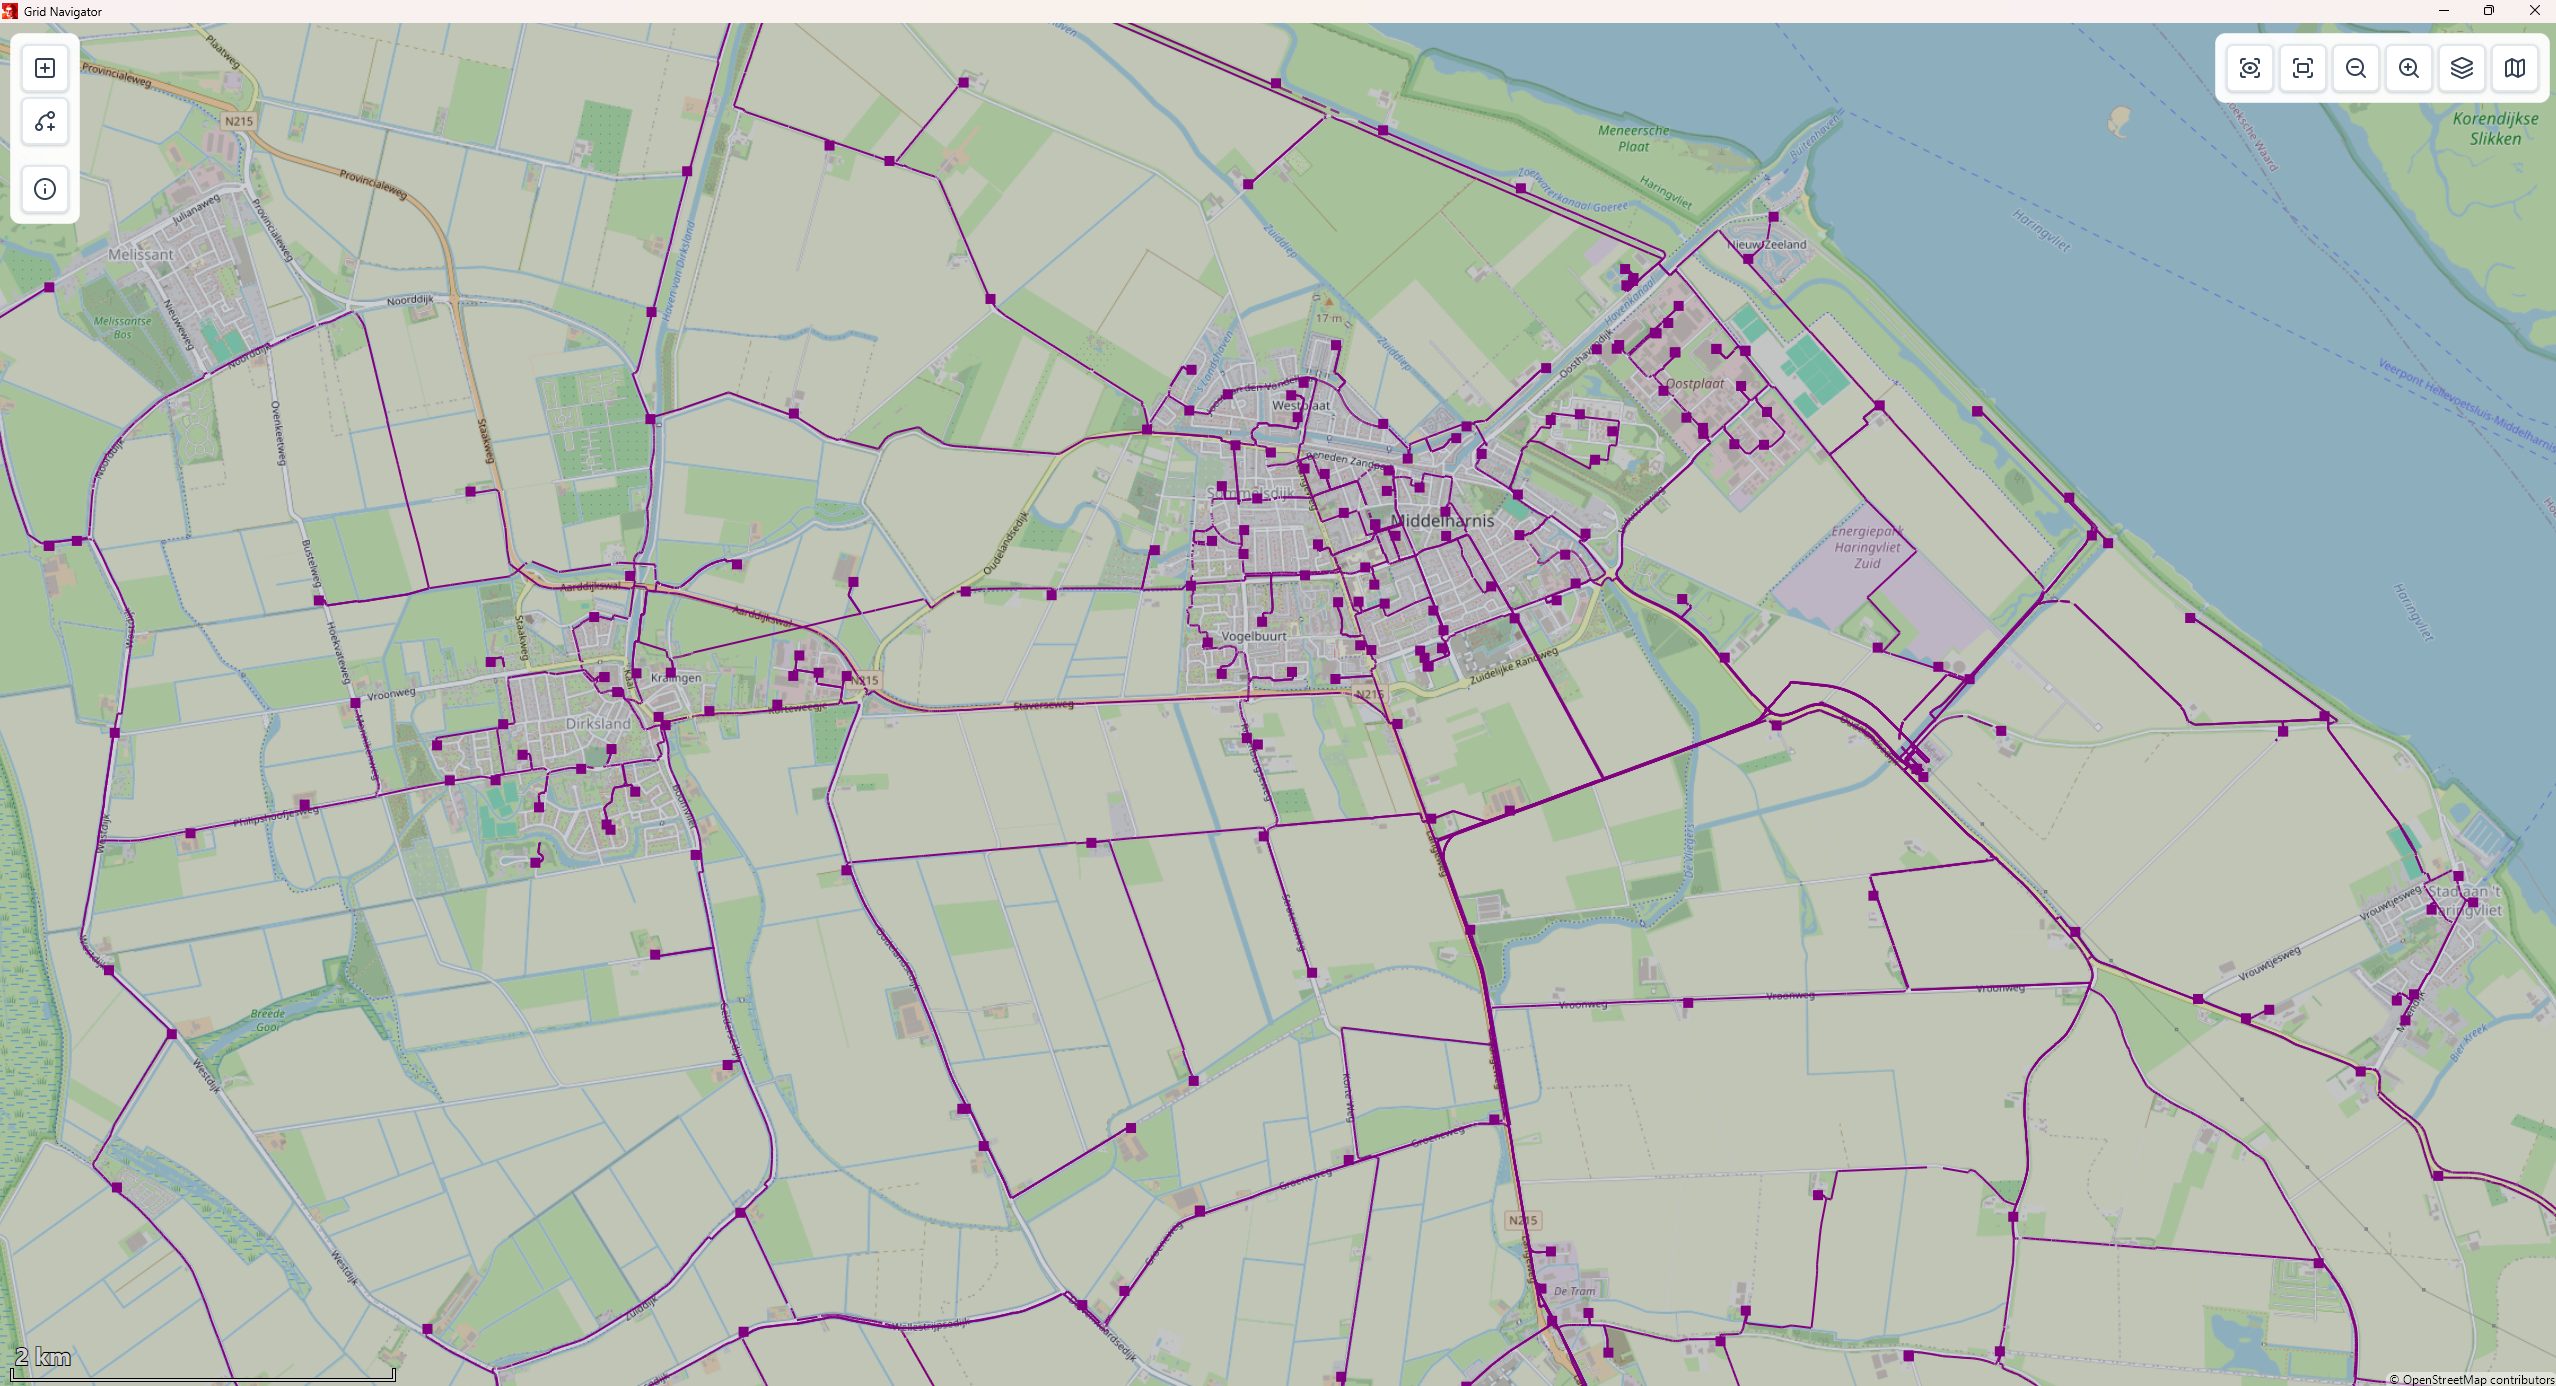
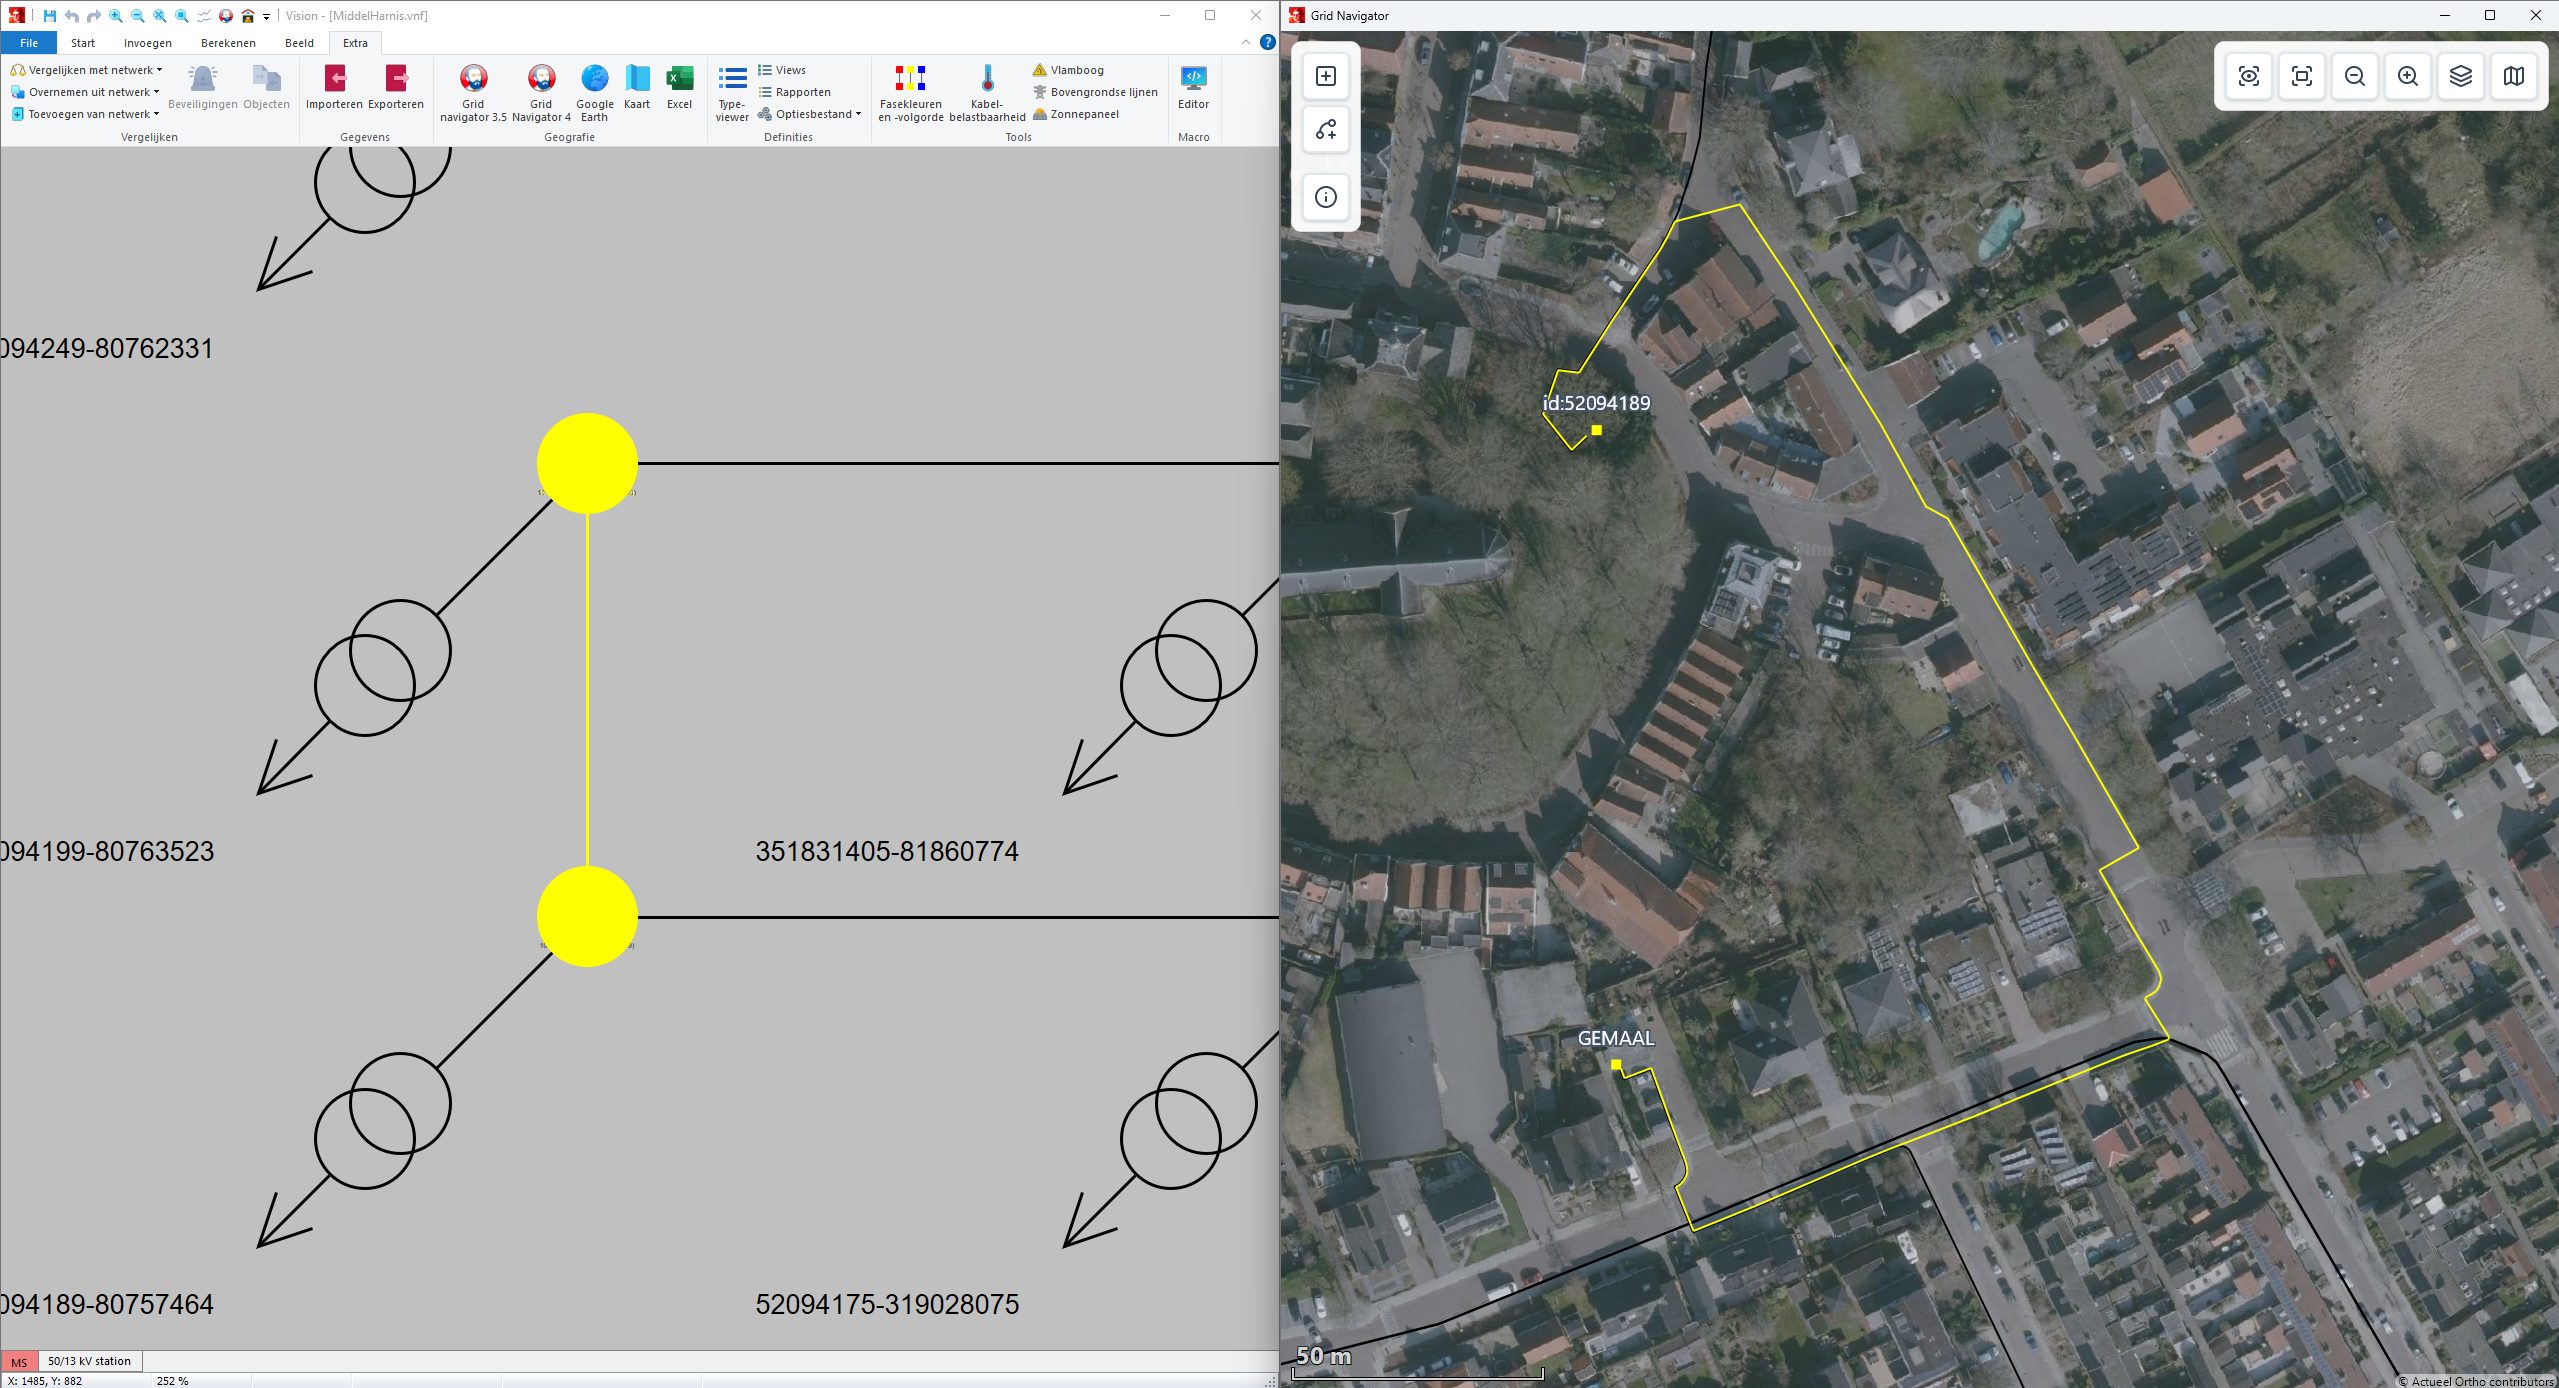
Vision Grid Navigator links calculation results from Vision Network Analysis and Gaia LV Network Design with data from geographic information systems (GIS). The program allows users to intuitively navigate through their networks. Thanks to the speed of the powerful Vulkan engine, Vision Grid Navigator provides direct and clear insight into grids. The geographical view in Vision Grid Navigator works seamlessly with the schematic view in Vision Network Analysis and Gaia LV Network Design.

For the geographical background, maps fromOpenStreetMap, Actueel Ortho and Esri Topo and photo data from Cyclomedia are used.
The geographical view supports the traditional schematic view and gives an improved insight.
Vision Grid Navigator expands Vision Network Analysis with a geographical viewer and editor. The program shows results of load flow calculations at the exact location. Questions like: “Which side of the road is a cable on?” or “Is there a specific load on an industrial site?” can be answered quickly.
The program shows the relevant parts of the network, which are simultaneously drawn schematically in Vision Network Analysis, and geographically in Vision Grid Navigator. From both programs, you can make selections and changes in the grid.
Vision Grid Navigator uses the digital maps of OpenStreetMap, Esri Topo and aerial photos from PDOK as a basis, allowing you to seamlessly zoom between national and street level.
The map can also display overlays with your own data in widely used formats.
Vision Grid Navigator is also capable of displaying aerial photographs at a resolution of 8 cm per pixel. Also, the 360° ambient pictures of Cyclomedia can be displayed with the projected location of cables.
Vision Grid Navigator places all nodes, lines and joints on the XY coordinates known from the GIS. A user can use the map to loop in new medium-voltage substations in existing cables. The new cable routes can then be edited geographically. Lengths are determined and can be taken directly into account in calculations.
By filtering the results of load flow calculations by cable load and/or node voltage, certain phenomena can be shown directly in a network. For example: show all cables with a load of more than 70%, or show the short-circuit power at all nodes.